Note to self: How to quickly set a colour scheme in ggplot2.
Imagine we have a series of plots that all need a uniform colour scale. The same category needs to have the same colour in all graphics, made possibly with different packages and by different people. Instead of hard-coding the colours and the order of categories, we can put them in a file, like so:
library(readr)
colours <- read_csv("scale_colours.csv")
# A tibble: 5 x 2
  name   colour

1 blue   #d4b9da
2 red    #c994c7
3 purple #df65b0
4 green  #dd1c77
5 orange #980043
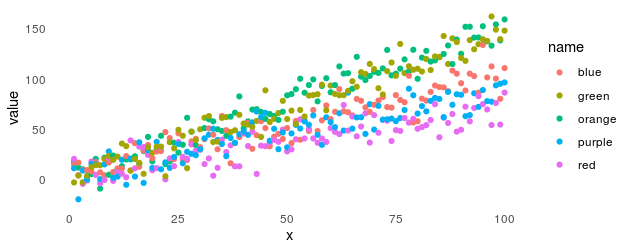
Now a plot with default colours, using some made-up data:
x <- 1:100

beta <- rnorm(5, 1, 0.5)

stroop <- data.frame(x,
                     sapply(beta, function(b) x * b + rnorm(100, 1, 10)))
colnames(stroop)[2:6] <- c("orange", "blue", "red", "purple", "green")

data_long <- pivot_longer(stroop, -x)

plot_y <- qplot(x = x,
                y = value,
                colour = name,
                data = data_long) +
  theme_minimal() +
  theme(panel.grid = element_blank())
Now we can add the custom scale like this:
plot_y_colours <- plot_y +
  scale_colour_manual(limits = colours$name,
                      values = colours$colour)

