”Dangerous gene myths abound”

Philip Ball, who is a knowledgeable and thoughtful science writer, published an piece in the Guardian a couple of months ago about the misunderstood legacy of the human genome project: ”20 years after the human genome was first sequenced, dangerous gene myths abound”.

The human genome project published the draft reference genome for the human species 20 years ago. Ball argues, in short, that the project was oversold with promises that it couldn’t deliver, and consequently has not delivered. Instead, the genome project was good for other things that had more to do with technology development and scientific infrastructure. The sequencing of the human genome was the platform for modern genome science, but it didn’t, for example, cure cancer or uncover a complete set of instructions for building a human.

He also argues that the rhetoric of human genome hype, which did not end with the promotion of the human genome project (see the ENCODE robot punching cancer in the face, for example), is harmful. It is scientifically harmful because it oversimplifies modern genetics, and it is politically harmful because it aligns well with genetic determinism and scientific racism.

I believe Ball is entirely right about this.

Selling out

The breathless hype around the human genome project was embarrassing. Ball quotes some fragments, but you can to to the current human genome project site and enjoy quotes like ”it’s a transformative textbook of medicine, with insights that will give health care providers immense new powers to treat, prevent and cure disease”. This image has some metonymical truth to it — human genomics is helping medical science in different ways — but even as a metaphor, it is obviously false. You can go look at the human reference genome if you want, and you will discover that the ”text” such as it is looks more like this than a medical textbook:

TTTTTTTTCCTTTTTTTTCTTTTGAGATGGAGTCTCGCTCTGCCGCCCAGGCTGGAGTGC
AGTAGCTCGATCTCTGCTCACTGCAAGCTCCGCCTCCCGGGTTCACGCCATTCTCCTGCC
TCAGCCTCCTGAGTAGCTGGGACTACAGGCGCCCACCACCATGCCCAGCTAATTTTTTTT
TTTTTTTTTTTGGTATTTTTAGTAGAGACGGGGTTTCACCGTGTTAGCCAGGATGGTCTC
AATCTCCTGACCTTGTGATCCGCCCGCCTCGGCCTCCCACAGTGCTGGGATTACAGGC

This is a human Alu element from chromosome 17. It’s also in an intron of a gene, flanking a promoter, a few hundred basepairs away from an insulator (see the Ensembl genome browser) … All that is stuff that cannot be read from the sequence alone. You might be able to tell that it’s Alu if you’re an Alu genius or run a sequence recognition software, but there is no to read the other contextual genomic information, and there is no way you can tell anything about human health by reading it.

I think Ball is right that this is part of simplistic genetics that doesn’t appreciate the complexity either quantitative or molecular genetics. In short, quantitative genetics, as a framework, says that inheritance of traits between relatives is due to thousands and thousands of genetic differences each of them with tiny effects. Molecular genetics says that each of those genetic differences may operate through any of a dizzying selection of Rube Goldberg-esque molecular mechanisms, to the point where understanding one of them might be a lifetime of laboratory investigation.

Simple inheritance is essentially a fiction, or put more politely: a simple model that is useful as a step to build up a more better picture of inheritance. This is not knew; the knowledge that everything of note is complex has been around since the beginning of genetics. Even rare genetic diseases understood as monogenic are caused by sometimes thousands of different variants that happen in a particular small subset of the genome. Really simple traits, in the sense of one variant–one phenotype, seldom happen in large mixing and migrating populations like humans; they may occur in crosses constructed in the lab, or in extreme structured populations like dog breeds or possibly with balancing selection.

Can you market thick sequencing?

Ball is also right about what it was most useful about the human genome project: it enabled research at scale into human genetic variation, and it stimulated development of sequencing methods, both generating and using DNA sequence. Lowe (2018) talks about ”thick” sequencing, a notion of sequencing that includes associated activities like assembly, annotation and distribution to a community of researchers — on top of ”thin” sequencing as determination of sequences of base pairs. Thick sequencing better captures how genome sequencing is used and stimulates other research, and aligns with how sequencing is an iterative process, where reference genomes are successively refined and updated in the face of new data, expert knowledge and quality checking.

It is hard to imagine gene editing like CRISPR being applied in any human cell without a good genome sequence to help find out what to cut out and what to put instead. It is hard to imagine the developments in functional genomics that all use short read sequencing as a read-out without having a good genome sequence to anchor the reads on. It is possible to imagine genome-wide association just based on very dense linkage maps, but it is a bit far-fetched. And so on.

Now, this raises a painful but interesting question: Would the genome project ever have gotten funded on reasonable promises and reasonable uncertainties? If not, how do we feel about the genome hype — necessary evil, unforgivable deception, something in-between? Ball seems to think that gene hype was an honest mistake and that scientists were surprised that genomes turned out to be more complicated than anticipated. Unlike him, I do not believe that most researchers honestly believed the hype — they must have known that they were overselling like crazy. They were no fools.

An example of this is the story about how many genes humans have. Ball writes:

All the same, scientists thought genes and traits could be readily matched, like those children’s puzzles in which you trace convoluted links between two sets of items. That misconception explains why most geneticists overestimated the total number of human genes by a factor of several-fold – an error typically presented now with a grinning “Oops!” rather than as a sign of a fundamental error about what genes are and how they work.

This is a complicated history. Gene number estimates are varied, but enjoy this passage from Lewontin in 1977:

The number of genes is not large

While higher organisms have enough DNA to specify from 100,000 to 1,000,000 proteins of average size, it appears that the actual number of cistrons does not exceed a few thousand. Thus, saturation lethal mapping of the fourth chromosome (Hochman, 1971) and the X chromosome (Judd, Shen and Kaufman, 1972) of Drosophila melanogbaster make it appear that there is one cistron per salivary chromosome band, of which there are 5,000 in this species. Whether 5,000 is a large or small number of total genes depends, of course, on the degree of interaction of various cistrons in influencing various traits. Nevertheless, it is apparent that either a given trait is strongly influenced by only a small number of genes, or else there is a high order of gene interactions among developmental systems. With 5,000 genes we cannot maintain a view that different parts of the organism are both independent genetically and each influenced by large number of gene loci.

I don’t know if underestimating by an few folds is worse than overestimating by a few folds (D. melanogaster has 15,000 protein-coding genes or so), but the point is that knowledgeable geneticists did not go around believing that there was a simple 1-to-1 mapping between genes and traits, or even between genes and proteins at this time. I know Lewontin is a population geneticist, and in the popular mythology population geneticists are nothing but single-minded bean counters who do not appreciate the complexity of molecular biology … but you know, they were no fools.

The selfish cistron

One thing Ball gets wrong is evolutionary genetics, where he mixes genetic concepts that, really, have very little to do with each other despite superficially sounding similar.

Yet plenty remain happy to propagate the misleading idea that we are “gene machines” and our DNA is our “blueprint”. It is no wonder that public understanding of genetics is so blighted by notions of genetic determinism – not to mention the now ludicrous (but lucrative) idea that DNA genealogy tells you which percentage of you is “Scots”, “sub-Saharan African” or “Neanderthal”.

This passage smushes two very different parts of genetics together, that don’t belong together and have nothing to do with with the preceding questions about how many genes there are or if the DNA is a blueprint: The gene-centric view of adaptation, a way of thinking of natural selection where you imagine genetic variants (not organisms, not genomes, not populations or species) as competing for reproduction; and genetic genealogy and ancestry models, where you describe how individuals are related based on the genetic variation they carry. The gene-centric view is about adaptation, while genetic genealogy works because of effectively neutral genetics that just floats around, giving us a unique individual barcode due to the sheer combinatorics.

He doesn’t elaborate on the gene machines, but it links to a paper (Ridley 1984) on Williams’ and Dawkins’ ”selfish gene” or ”gene-centric perspective”. I’ve been on about this before, but when evolutionary geneticists say ”selfish gene”, they don’t mean ”the selfish protein-coding DNA element”; they mean something closer to ”the selfish allele”. They are not committed to any view that the genome is a blueprint, or that only protein-coding genes matter to adaptation, or that there is a 1-to-1 correspondence between genetic variants and traits.

This is the problem with correcting misconceptions in genetics: it’s easy to chide others for being confused about the parts you know well, and then make a hash of some other parts that you don’t know very well yourself. Maybe when researchers say ”gene” in a context that doesn’t sound right to you, they have a different use of the word in mind … or they’re conceptually confused fools, who knows.

Literature

Lewontin, R. C. (1977). The relevance of molecular biology to plant and animal breeding. In International Conference on Quantitative Genetics. Ames, Iowa (USA). 16-21 Aug 1976.

Lowe, J. W. (2018). Sequencing through thick and thin: Historiographical and philosophical implications. Studies in History and Philosophy of Science Part C: Studies in History and Philosophy of Biological and Biomedical Sciences, 72, 10-27.

Theory in genetics

A couple of years ago, Brian Charlesworth published this essay about the value of theory in Heredity. He liked the same Sturtevant & Beadle quote that I liked.

Two outstanding geneticists, Alfred Sturtevant and George Beadle, started their splendid 1939 textbook of genetics (Sturtevant and Beadle 1939) with the remark ‘Genetics is a quantitative subject. It deals with ratios, and with the geometrical relationships of chromosomes. Unlike most sciences that are based largely on mathematical techniques, it makes use of its own system of units. Physics, chemistry, astronomy, and physiology all deal with atoms, molecules, electrons, centimeters, seconds, grams—their measuring systems are all reducible to these common units. Genetics has none of these as a recognizable component in its fundamental units, yet it is a mathematically formulated subject that is logically complete and self contained’.

This statement may surprise the large number of contemporary workers in genetics, who use high-tech methods to analyse the functions of genes by means of qualitative experiments, and think in terms of the molecular mechanisms underlying the cellular or developmental processes, in which they are interested. However, for those who work on transmission genetics, analyse the genetics of complex traits, or study genetic aspects of evolution, the core importance of mathematical approaches is obvious.

Maybe this comes a surprise to some molecularly minded biologists; I doubt those working adjacent to a field called ”biophysics” or trying to understand what on Earth a ”t-distributed stochastic neighbor embedding” does to turn single-cell sequences into colourful blobs will have missed that there are quantitative aspects to genetics.

Anyways, Sturtevant & Beadle (and Charlesworth) are thinking of another kind of quantitation: they don’t just mean that maths is useful to geneticists, but of genetics as a particular kind of abstract science with its own concepts. It’s the distinction between viewing genetics as chemistry and genetics as symbols. In this vein, Charlesworth makes the distinction between statistical estimation and mathematical modelling in genetics, and goes on to give examples of the latter by an anecdotal history models of genetic variation, eventually going deeper into linkage disequilibrium. It’s a fun read, but it doesn’t really live up to the title by spelling out actual arguments for mathematical models, other than the observation that they have been useful in population genetics.

The hypothetical recurring reader will know this blog’s position on theory in genetics: it is useful, not just for theoreticians. Consequently, I agree with Charlesworth that formal modelling in genetics is a good thing, and that there is (and ought to be more of) constructive interplay between data and theory. I like that he suggests that mathematical models don’t even have to be that sophisticated to be useful; even if you’re not a mathematician, you can sometimes improve your understanding by doing some sums. He then takes that back a little by telling a joke about how John Maynard Smith’s paper on hitch-hiking was so difficult that only two researchers in the country could be smart enough to understand it. The point still stands. I would add that this applies to even simpler models than I suspect that Charlesworth had in mind. Speaking from experience, a few pseudo-random draws from a binomial distribution can sometimes clear your head about a genetic phenomenon, and while this probably won’t amount to any great advances in the field, it might save you days of fruitless faffing.

As it happens, I also recently read this paper (Robinaugh et al. 2020) about the value of formal theory in psychology, and in many ways, it makes explicit some things that Charlesworth’s essay doesn’t spell out, but I think implies: We want our scientific theories to explain ”robust, generalisable features of the world” and represent the components of the world that give rise to those phenomena. Formal models, expressed in precise languages like maths and computational models are preferable to verbal models, that express the structure of a theory in words, because these precise languages make it easier to deduce what behaviour of the target system that the model implies. Charlesworth and Robinaugh et al. don’t perfectly agree. For one thing, Robinaugh et al. seem to suggest that a good formal model should be able to generate fake data that can be compared to empirical data summaries and give explanations of computational models, while Charlesworth seems to view simulation as an approximation one sometimes has to resort to.

However, something that occurred to me while reading Charlesworth’s essay was the negative framing of why theory is useful. This is how Charlesworth recommends mathematical modelling in population genetic theory, by approvingly repeating this James Crow quote:

I hope to have provided evidence that the mathematical modelling of population genetic processes is crucial for a proper understanding of how evolution works, although there is of course much scope for intuition and verbal arguments when carefully handled (The Genetical Theory of Natural Selection is full of examples of these). There are many situations in which biological complexity means that detailed population genetic models are intractable, and where we have to resort to computer simulations, or approximate representations of the evolutionary process such as game theory to produce useful results, but these are based on the same underlying principles. Over the past 20 years or so, the field has moved steadily away from modelling evolutionary processes to developing statistical tools for estimating relevant parameters from large datasets (see Walsh and Lynch 2017 for a comprehensive review). Nonetheless, there is still plenty of work to be done on improving our understanding of the properties of the basic processes of evolution.

The late, greatly loved, James Crow used to say that he had no objection to graduate students in his department not taking his course on population genetics, but that he would like them to sign a statement that they would not make any pronouncements about evolution. There are still many papers published with confused ideas about evolution, suggesting that we need a ‘Crow’s Law’, requiring authors who discuss evolution to have acquired a knowledge of basic population genetics.

This is one of the things I prefer about Robinaugh et al.’s account: To them, theory is not mainly about clearing up confusion and wrongness, but about developing ideas by checking their consistency with data, and exploring how they can be modified to be less wrong. And when we follow Charlesworth’s anecdotal history of linked selection, it can be read as sketching a similar path. It’s not a story about some people knowing ”basic population genetics” and being in the right, and others now knowing it and being confused (even if that surely happens also); it’s about a refinement of models in the face of data — and probably vice versa.

If you listen to someone talking about music theory, or literary theory, they will often defend themselves against the charge that theory drains their domain of the joy and creativity. Instead, they will argue that theory helps you appreciate the richness of music, and gives you tools to invent new and interesting music. You stay ignorant of theory at your own peril, not because you risk doing things wrong, but because you risk doing uninteresting rehashes, not even knowing what you’re missing. Or something like that. Adam Neely (”Why you should learn music theory”, YouTube video) said it better. Now, the analogy is not perfect, because the relationship between empirical data and theory in genetics is such that the theory really does try to say true or false things about the genetics in a way that music theory (at least as practiced by music theory YouTubers) does not. I still think there is something to be said for theory as a tool for creativity and enjoyment in genetics.

Literature

Charlesworth, B. (2019). In defence of doing sums in genetics. Heredity, 123(1), 44-49.

Robinaugh, D., Haslbeck, J., Ryan, O., Fried, E. I., & Waldorp, L. (2020). Invisible hands and fine calipers: A call to use formal theory as a toolkit for theory construction. Paper has since been published in a journal, but I read the preprint.

A model of polygenic adaptation in an infinite population

How do allele frequencies change in response to selection? Answers to that question include ”it depends”, ”we don’t know”, ”sometimes a lot, sometimes a little”, and ”according to a nonlinear differential equation that actually doesn’t look too horrendous if you squint a little”. Let’s look at a model of the polygenic adaptation of an infinitely large population under stabilising selection after a shift in optimum. This model has been developed by different researchers over the years (reviewed in Jain & Stephan 2017).

Here is the big equation for allele frequency change at one locus:

\dot{p}_i = -s \gamma_i p_i q_i (c_1 - z') - \frac{s \gamma_i^2}{2} p_i q_i (q_i - p_i) + \mu (q_i - p_i )

That wasn’t so bad, was it? These are the symbols:

  • the subscript i indexes the loci,
  • \dot{p} 
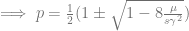
is the change in allele frequency per time,
  • \gamma_i is the effect of the locus on the trait (twice the effect of the positive allele to be precise),
  • p_i is the frequency of the positive allele,
  • q_i the frequency of the negative allele,
  • s is the strength of selection,
  • c_1 is the phenotypic mean of the population; it just depends on the effects and allele frequencies
  • \mu is the mutation rate.

This breaks down into three terms that we will look at in order.

The directional selection term

-s \gamma_i p_i q_i (c_1 - z')

is the term that describes change due to directional selection.

Apart from the allele frequencies, it depends on the strength of directional selection s, the effect of the locus on the trait \gamma_i and how far away the population is from the new optimum (c_1 - z'). Stronger selection, larger effect or greater distance to the optimum means more allele frequency change.

It is negative because it describes the change in the allele with a positive effect on the trait, so if the mean phenotype is above the optimum, we would expect the allele frequency to decrease, and indeed: when

(c_1 - z') < 0

this term becomes negative.

If you neglect the other two terms and keep this one, you get Jain & Stephan's "directional selection model", which describes behaviour of allele frequencies in the early phase before the population has gotten close to the new optimum. This approximation does much of the heavy lifting in their analysis.

The stabilising selection term

-\frac{s \gamma_i^2}{2} p_i q_i (q_i - p_i)

is the term that describes change due to stabilising selection. Apart from allele frequencies, it depends on the square of the effect of the locus on the trait. That means that, regardless of the sign of the effect, it penalises large changes. This appears to make sense, because stabilising selection strives to preserve traits at the optimum. The cubic influence of allele frequency is, frankly, not intuitive to me.

The mutation term

Finally,

\mu (q_i - p_i )

is the term that describes change due to new mutations. It depends on the allele frequencies, i.e. how of the alleles there are around that can mutate into the other alleles, and the mutation rate. To me, this is the one term one could sit down and write down, without much head-scratching.

Walking in allele frequency space

Jain & Stephan (2017) show a couple of examples of allele frequency change after the optimum shift. Let us try to draw similar figures. (Jain & Stephan don’t give the exact parameters for their figures, they just show one case with effects below their threshold value and one with effects above.)

First, here is the above equation in R code:

pheno_mean <- function(p, gamma) {
  sum(gamma * (2 * p - 1))
}

allele_frequency_change <- function(s, gamma, p, z_prime, mu) {
  -s * gamma * p * (1 - p) * (pheno_mean(p, gamma) - z_prime) +
    - s * gamma^2 * 0.5 * p * (1 - p) * (1 - p - p) +
    mu * (1 - p - p)
}

With this (and some extra packaging; code on Github), we can now plot allele frequency trajectories such as this one, which starts at some arbitrary point and approaches an optimum:

Animation of alleles at two loci approaching an equilibrium. Here, we have two loci with starting frequencies 0.2 and 0.1 and effect size 1 and 0.01, and the optimum is at 0. The mutation rate is 10-4 and the strength of selection is 1. Animation made with gganimate.

Resting in allele frequency space

The model describes a shift from one optimum to another, so we want want to start at equilibrium. Therefore, we need to know what the allele frequencies are at equilibrium, so we solve for 0 allele frequency change in the above equation. The first term will be zero, because

(c_1 - z') = 0

when the mean phenotype is at the optimum. So, we can throw away that term, and factor the rest equation into:

(1 - 2p) (-\frac{s \gamma ^2}{2} p(1-p) + \mu) = 0

Therefore, one root is p = 1/2
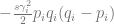
. Depending on your constitution, this may or may not be intuitive to you. Imagine that you have all the loci, each with a positive and negative allele with the same effect, balanced so that half the population has one and the other half has the other. Then, there is this quadratic equation that gives two other equilibria:

\mu - \frac{s\gamma^2}{2}p(1-p) = 0
\implies p = \frac{1}{2} (1 \pm \sqrt{1 - 8 \frac{\mu}{s \gamma ^2}})

These points correspond to mutation–selection balance with one or the other allele closer to being lost. Jain & Stephan (2017) show a figure of the three equilibria that looks like a semicircle (from the quadratic equation, presumably) attached to a horizontal line at 0.5 (their Figure 1). Given this information, we can start our loci out at equilibrium frequencies. Before we set them off, we need to attend to the effect size.

How big is a big effect? Hur långt är ett snöre?

In this model, there are big and small effects with qualitatively different behaviours. The cutoff is at:

\hat{\gamma} = \sqrt{ \frac{8 \mu}{s}}

If we look again at the roots to the quadratic equation above, they can only exist as real roots if

\frac {8 \mu}{s \gamma^2} < 1

because otherwise the expression inside the square root will be negative. This inequality can be rearranged into:

\gamma^2 > \frac{8 \mu}{s}

This means that if the effect of a locus is smaller than the threshold value, there is only one equilibrium point, and that is at 0.5. It also affects the way the allele frequency changes. Let us look at two two-locus cases, one where the effects are below this threshold and one where they are above it.

threshold <- function(mu, s) sqrt(8 * mu / s)

threshold(1e-4, 1)
[1] 0.02828427

With mutation rate of 10-4 and strength of selection of 1, the cutoff is about 0.028. Let our ”big” loci have effect sizes of 0.05 and our small loci have effect sizes of 0.01, then. Now, we are ready to shift the optimum.

The small loci will start at an equilibrium frequency of 0.5. We start the large loci at two different equilibrium points, where one positive allele is frequent and the other positive allele is rare:

get_equilibrium_frequencies <- function(mu, s, gamma) {
  c(0.5,
    0.5 * (1 + sqrt(1 - 8 * mu / (s * gamma^2))),
    0.5 * (1 - sqrt(1 - 8 * mu / (s * gamma^2))))
}

(eq0.05 <- get_equilibrium_frequencies(1e-4, 1, 0.05))
[1] 0.50000000 0.91231056 0.08768944
get_equlibrium_frequencies(1e-4, 1, 0.01)
[1] 0.5 NaN NaN

Look at them go!

These animations show the same qualitative behaviour as Jain & Stephan illustrate in their Figure 2. With small effects, there is gradual allele frequency change at both loci:

However, with large effects, one of the loci (the one on the vertical axis) dramatically changes in allele frequency, that is it’s experiencing a selective sweep, while the other one barely changes at all. And the model will show similar behaviour when the trait is properly polygenic, with many loci, as long as effects are large compared to the (scaled) mutation rate.

Here, I ran 10,000 time steps; if we look at the phenotypic means, we can see that they still haven’t arrived at the optimum at the end of that time. The mean with large effects is at 0.089 (new optimum of 0.1), and the mean with small effects is 0.0063 (new optimum: 0.02).

Let’s end here for today. Maybe another time, we can return how this model applies to actually polygenic architectures, that is, with more than two loci. The code for all the figures is on Github.

Literature

Jain, K., & Stephan, W. (2017). Modes of rapid polygenic adaptation. Molecular biology and evolution, 34(12), 3169-3175.

Journal club of one: ”Versatile simulations of admixture and accurate local ancestry inference with mixnmatch and ancestryinfer”

Admixture is the future of every sub-field of genetics, just in case you didn’t know. Both in the wild and domestic animals, populations or even species sometimes cross. This causes different patterns of relatedness than in well-mixed populations. Often we want to estimate ”local ancestry”, that is: what source population a piece of chromosome in an individual originates from. It is one of those genetics problems that is made harder by the absence of any way to observe it directly.

This recent paper (Schumer et al 2020; preprint version, which I read, here) presents a method for simulating admixed sequence data, and a method for inferring local ancestry from it. It does something I like, namely to pair analysis with fake-data simulation to check methods.

The simulation method is a built from four different simulators:

1. macs (Chen, Majoram & Wall 2009), which creates polymorphism data under neutral evolution from a given population history. They use macs to generate starting chromosomes from two ancestral populations.

2. Seq-Gen (Rambaut & Grassly 1997). Chromosomes from macs are strings of 0s and 1s representing the state at biallelic markers. If you want DNA-level realism, with base composition, nucleotide substitution models and so on, you need something else. I don’t really follow how they do this. You can tell from the source code that they use the local trees that macs spits out, which Seq-Gen can then simulate nucleotides from. As they put it, the resulting sequence ”lacks other complexities of real genome sequences such as repetitive elements and local variation in base composition”, but it is a step up from ”0000110100”.

3. SELAM (Corbett-Detig & Jones 2016), which simulates admixture between populations with population history and possibly selection. Here, SELAM‘s role is to simulate the actual recombination and interbreeding to create the patterns of local ancestry, that they will then fill with the sequences they generated before.

4. wgsim, which simulates short reads from a sequence. At this point, mixnmatch has turned a set of population genetic parameters into fasta files. That is pretty cool.

On the one hand, building on tried and true tools seems to be the right thing to do, less wheel-reinventing. It’s great that the phylogenetic simulator Seq-Gen from 1997 can be used in a paper published in 2020. On the other hand, looking at the dependencies for running mixnmatch made me a little pale: seven different bioinformatics or population genetics softwares (not including the dependencies you need to compile them), R, Perl and Python plus Biopython. Computational genetics is an adventure of software installation.

They use the simulator to test the performance of a hidden Markov model for inferring local ancestry (Corbett-Detig & Nielsen 2017) with different population histories and settings, and then apply it to swordtail fish data. In particular, one needs to set thresholds for picking ”ancestry informative” (i.e. sufficiently differentiated) markers between the ancestral populations, and that depends on population history and diversity.

In passing, they use the estimate the swordtail recombination landscape:

We used the locations of observed ancestry transitions in 139 F2 hybrids that we generated between X. birchmanni and X. malinche … to estimate the recombination rate in 5 Mb windows. … We compared inferred recombination rates in this F2 map to a linkage disequilibrium based recombination map for X. birchmanni that we had previously generated (Schumer et al., 2018). As expected, we observed a strong correlation in estimated recombination rate between the linkage disequilibrium based and crossover maps (R=0.82, Figure 4, Supporting Information 8). Simulations suggest that the observed correlation is consistent with the two recombination maps being indistinguishable, given the low resolution of the F2 map (Supporting Information 8).