Preprint: ”Genetics of tibia bone properties of crossbred commercial laying hens in different housing systems”

We have a new preprint posted to Biorxiv looking into the genetic basis of bone strength and other bone properties in crossbred laying hens in two different housing environments (furnished cages and floor pens).

Here are the citation and abstract:

Martin Johnsson, Helena Wall, Fernando A Lopes Pinto, Robert H. Fleming, Heather A. McCormack, Cristina Benavides-Reyes, Nazaret Dominguez-Gasca, Estefania Sanchez-Rodriguez, Ian C. Dunn, Alejandro B. Rodriguez-Navarro, Andreas Kindmark, Dirk-Jan de Koning (2021) Genetics of tibia bone properties of crossbred commercial laying hens in different housing systems. bioRxiv 2021.06.21.449243

Osteoporosis and bone fractures are a severe problem for the welfare of laying hens, with genetics and environment, such as housing system, each making substantial contributions to bone strength. In this work, we performed genetic analyses of bone strength, bone mineral density and bone composition, as well as body weight, in 860 commercial crossbred laying hens from two different companies, kept in either furnished cages or floor pens. We compared bone traits between housing systems and crossbreds, and performed a genome-wide association study of bone properties and body weight.

As expected, the two housing systems produced a large difference in bone strength, with layers housed in floor pens having stronger bones. These differences were accompanied by differences in bone geometry, mineralisation and chemical composition. Genome-scans either combining or independently analysing the two housing systems revealed no genome-wide significant loci for bone breaking strength. We detected three loci for body weight that were shared between the housing systems on chromosomes 4, 6 and 27 (either genome-wide significant or suggestive when the housing systems were analysed individually) and these coincide with associations for bone length.

In summary, we found substantial differences in bone strength, content and composition between hens kept in floor pens and furnished cages that could be attributed to greater physical activity in pen housing. We found little evidence for large-effect loci for bone strength in commercial crossbred hens, consistent with a highly polygenic architecture for bone strength in the production environment. The lack of consistent genetic associations between housing systems in combination with the differences in bone phenotypes support gene-by-environment interactions with housing system.

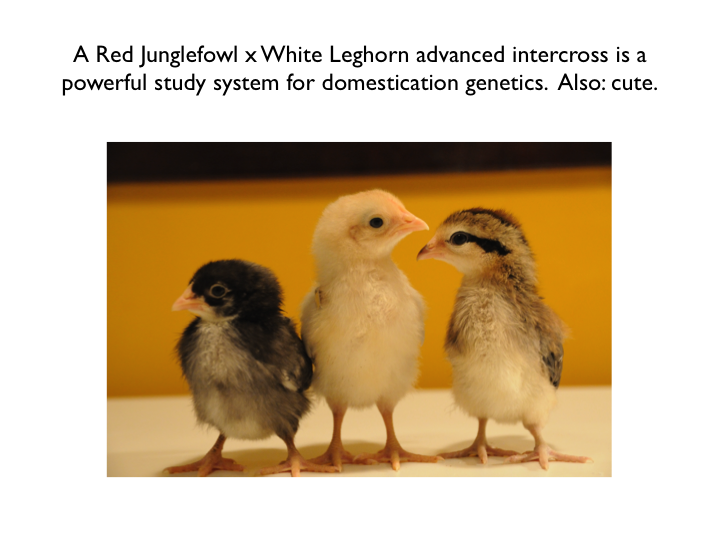
The background is that bone quality is a serious problem for laying hens; that housing systems that allow for more movement are known to lead to stronger bones; and that previous work on the genetics of bone parameters comes mostly from pure lines or from experimental intercrosses between divergent lines. Here, we study commercial crossbred laying hens from two different companies.

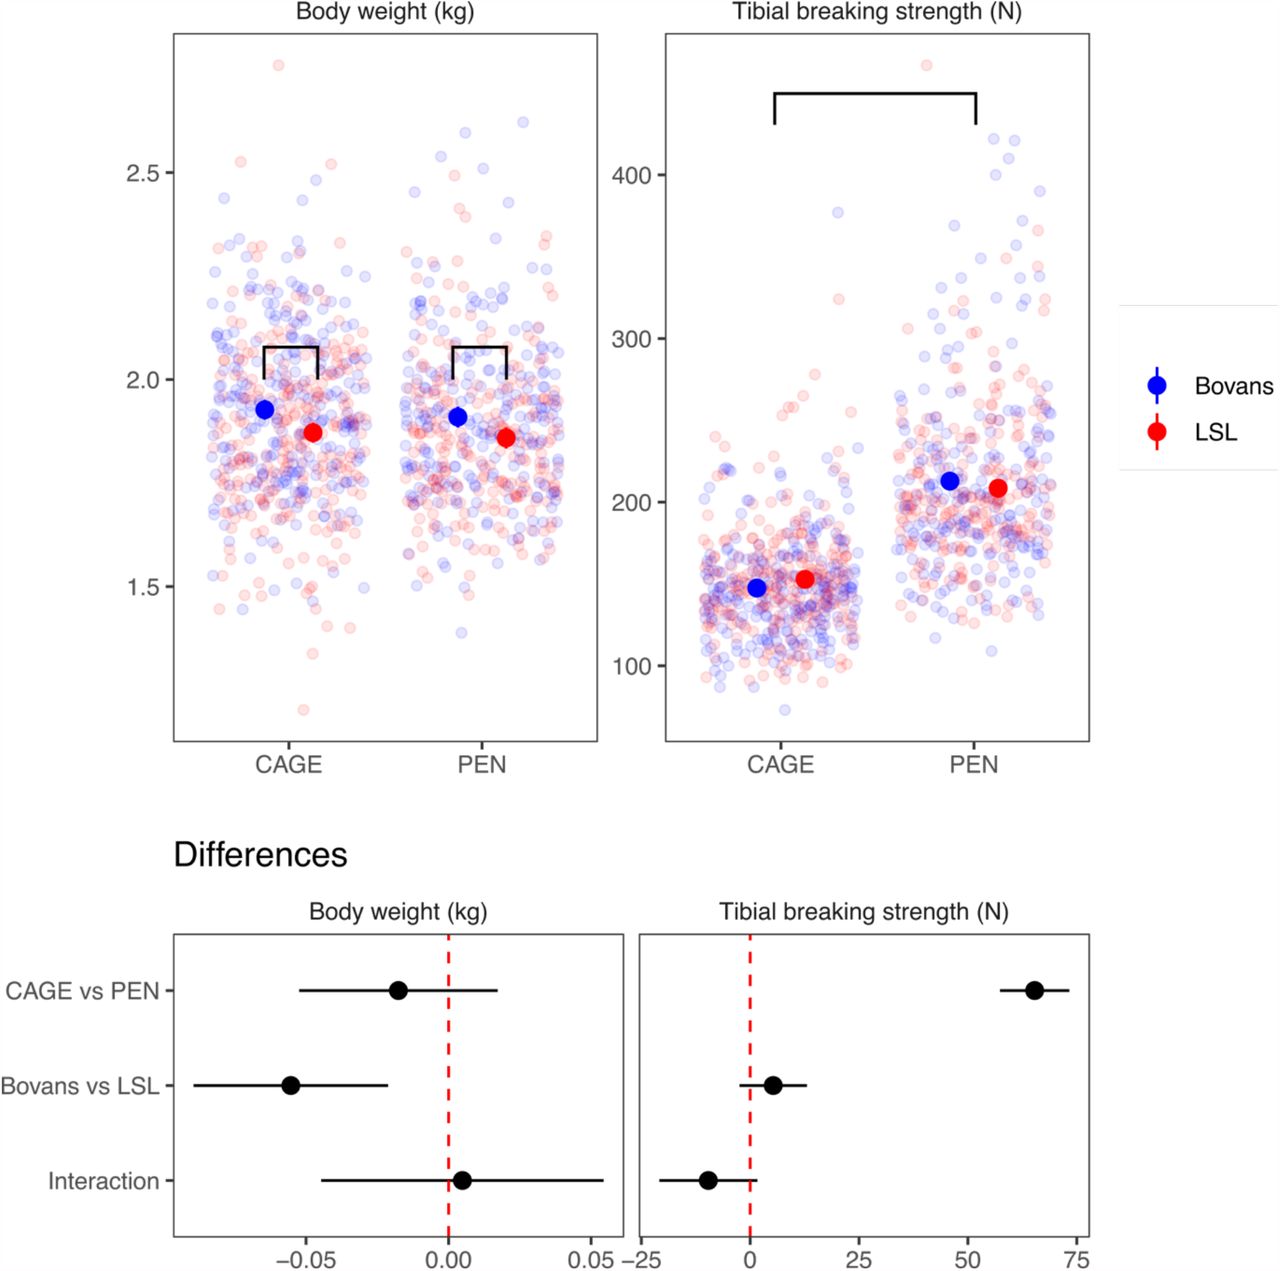
Being housed in a floor pen, where there is more opportunity for physical activity, or in a furnished cage makes a big difference to bone breaking strength. For comparison, we also show body weight, which is not much different between the housing environments. This difference was accompanied by differences in bone composition (see details in the paper).

And here are the Manhattan plots from genome-wide association: bone strength shows no major loci, as opposed to body weight, which has strong associations that are shared between the housing systems.

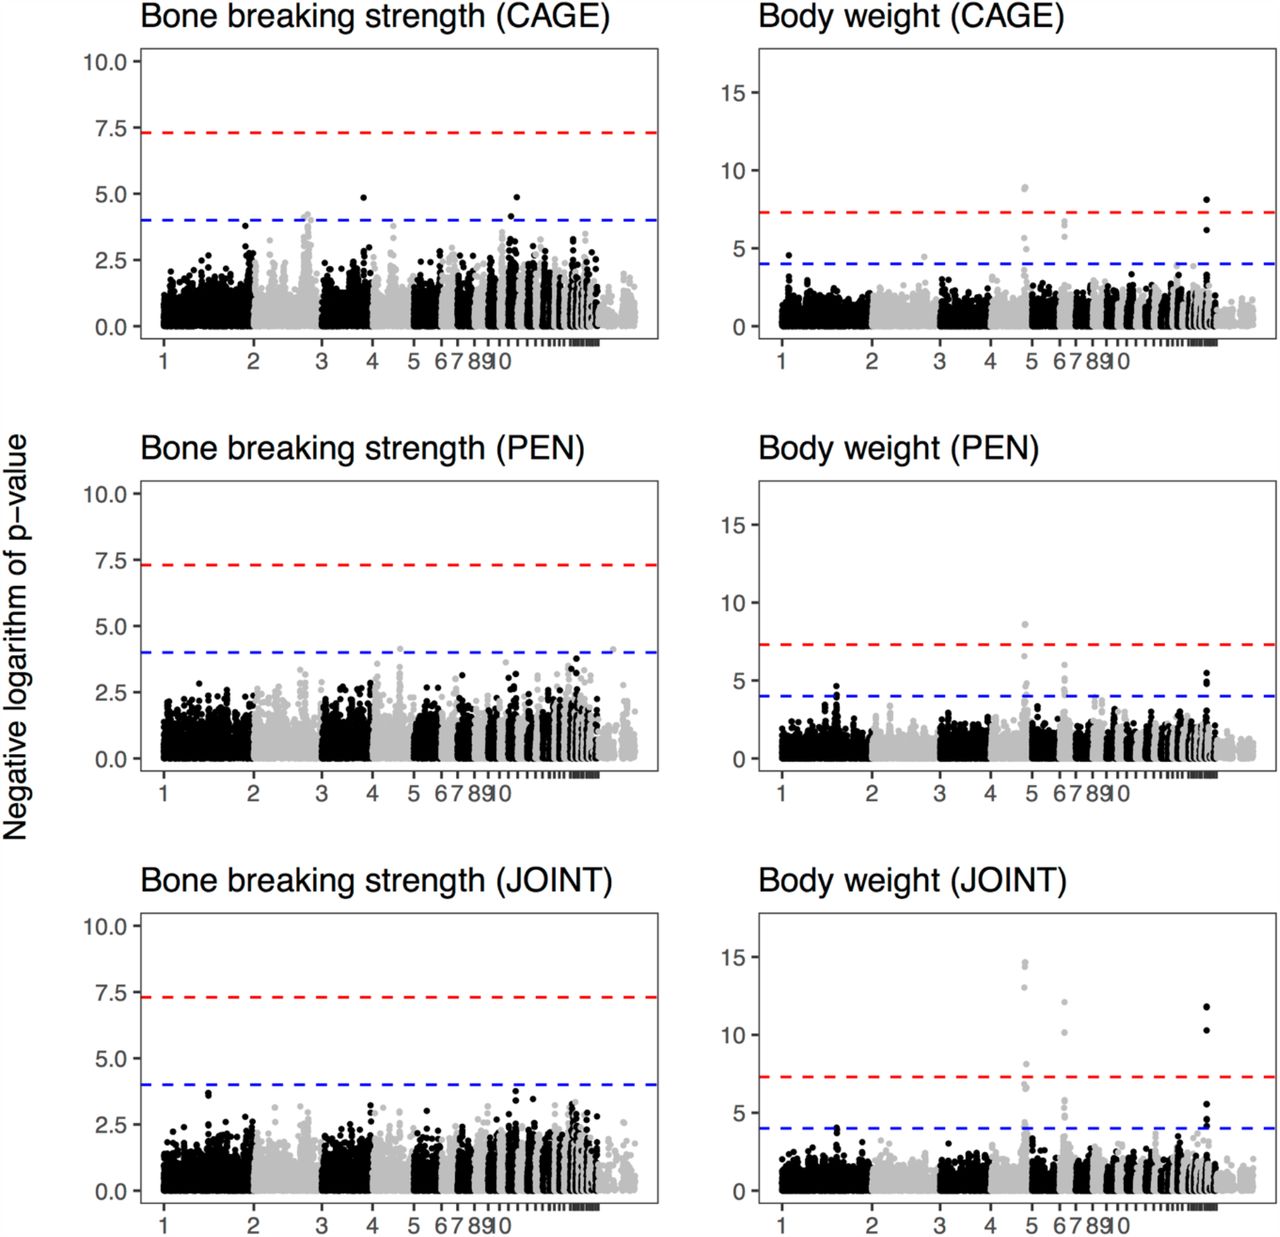
And if we compare the genome-wide associations, marker for marker, between the housing systems, there is nothing in common between the suggestive associations for bone strength. (Body weight below for comparison.)

This includes not detecting major loci for bone strength that have been found in pure lines of chickens. We think this is due to gene-by-environment interactions with housing (i.e. physical activity). This might be a complication for genomic selection for bone quality, as selection might need to be targeted to different housing systems.

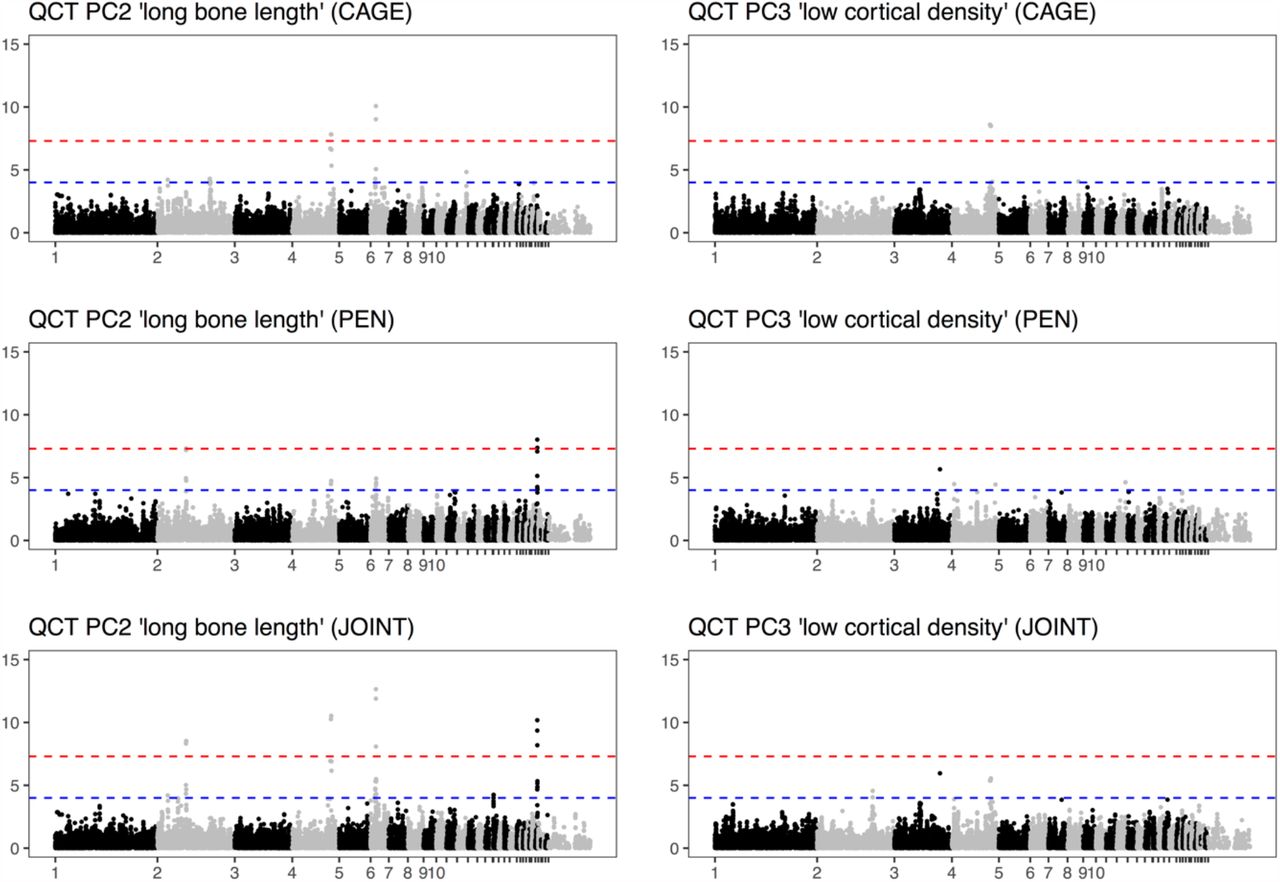
Finally, the three strong association for body weight shown above overlap previously detected loci on chromosomes 4, 6, and 27. We do not have the genomic resolution to nominate candidate genes with any confidence, but the chromosome 4 locus overlaps both the CCKAR gene, which is a strong candidate for growth and body mass in the chicken and the LCORL/NCAPG locus, which has been associated with body size in several species. These regions (plus a fourth one) are also associated with bone length:

Paper: ”Heritable genome-wide variation of gene expression and promoter methylation between wild and domesticated chickens”

Since I love author blog posts about papers, I thought I’d write a little about papers I’ve contributed too. So far, they’re not that many, but maybe it can be a habit.

Heritable genome-wide variation of gene expression and promoter methylation between wild and domesticated chickens” was published in BMC Genomics in 2012. The title says it very well: the paper looks at differential expression and DNA methylation of a subset of genes in the hypothalamus of Red Junglefowl and domestic White Leghorn chickens. My contribution was during my MSc project in the group. Previously (Lindqvist & al 2007; Nätt & al 2009) Daniel Nätt, Pelle Jensen and others found a transgenerational effect of unpredictable light stress on domestic chickens. After that, and being interested in chicken domestication, a DNA methylation comparison of wild and domestic seems like a natural thing to do. And it turns out Red Junglefowl and White Leghorns differ in expression of a bunch of genes and in methylation of certain promoters (where promoter is operationally defined as a region around the start of the gene model). And when looking at two generations, the contrasts are correlated between parent and offspring. There is some heritable basis of the differences in gene expression and  DNA methylation.

In Red Junglefowl, ancestor of domestic chickens, gene expression and methylation profiles in thalamus/hypothalamus differed substantially from that of a domesticated egg laying breed. Expression as well as methylation differences were largely maintained in the offspring, demonstrating reliable inheritance of epigenetic variation.

What I did was methylation sensitive high resolution melting. HRM is a typing method based on real time PCR. After PCR you often make a melting curve by ramping up the temperature, denaturing the PCR product. The melting characteristics depend on the sequence, so you can use melting to check that you get the expected PCR product, and it turns out that the difference can be big enough to type SNPs. And if you can type SNPs, you can analyse DNA methylation. So we treat the DNA with bisulfite, which deaminates cytosines to uracil unless they are protected by methylation, and get a converted sequence where an unmethylated C is like a C>T SNP. We set up standard curves with a mixture of whole-genome amplified and in vitro methylated DNA and measured the degree of methylation.

That is averaging over the population of DNA molecules in the sample; I’ve been wondering how HRM performs when the CpGs in the amplicon have heterogenous methylation differences. We’ve used HRM for genotyping as well, and it works, but we’ve switched to pyrosequencing, which gives cleaner results and where the assay design is much easier to get right the first time. I don’t know whether the same applies for methylation analysis with pyro.

heritability_methylation_fig4b

My favourite part of the paper is figure 4b (licence: cc:by 2.0) which shows methylation analysis in the advanced intercross of Red Junglefowl and White Leghorns, which immediately leads to, as mentioned in the paper, the thought of DNA methylation QTL mapping.

Literature

Nätt, D., Rubin, C. J., Wright, D., Johnsson, M., Beltéky, J., Andersson, L., & Jensen, P. (2012). Heritable genome-wide variation of gene expression and promoter methylation between wild and domesticated chickens. BMC genomics, 13(1), 59.

Lindqvist C, Janczak AM, Nätt D, Baranowska I, Lindqvist N, et al. (2007) Transmission of Stress-Induced Learning Impairment and Associated Brain Gene Expression from Parents to Offspring in Chickens. PLoS ONE 2(4): e364. doi:10.1371/journal.pone.0000364

Nätt D, Lindqvist N, Stranneheim H, Lundeberg J, Torjesen PA, et al. (2009) Inheritance of Acquired Behaviour Adaptations and Brain Gene Expression in Chickens. PLoS ONE 4(7): e6405. doi:10.1371/journal.pone.0006405

Journal club of one: ”Short copy number variations potentially associated with tonic immobility response in newly hatched chicks”

(‘Journal club of one’ will be quick notes on papers, probably mostly about my favourite topics — genetics and the noble chicken.)

Abe, Nagao & Inoue-Murayama (2013), recently published this paper in PLOS ONE about copy number variants and tonic immobility in two kinds of domestic chicken. This obviously interests me for several reasons: I’m working on the genetic basis of some traits in the chicken; tonic immobility is a fun and strange behaviour — how it works and if it has any adaptive importance is pretty much unknown, but it is a classic from the chicken literature — and the authors use QTL regions derived directly from the F2 generation of cross that I’m working on — we’ve published one paper so far on the F8 generation.

Results: They use arrays and qPCR to search for copy number variants in three regions on chromosome one in two breeds (White Leghorn and Nagoya, a Japanese breed). After quite a bit of filtering they end up with a few variants that differ between the breeds. The breeds also differ in their tonic immobility behaviour with Leghorns going into tonic immobility after three attempts on average and lying still for 75 s and Nagoya taking 4.5 attempts and lying for 100 s on average. But the copy number variants were not associated with tonic immobility attempts or duration within breeds, so there is not really any evidence that they affect tonic immobility behaviour.

Comments:

Apart from the issue that the regions (more than 60 Mb) will contain lots of other variants, we do not know whether these regions affect tonic immobility behaviour in these breeds in the first place. The intercross that the QTL come from is a wild by domestic Red Junglefowl x White Leghorn cross, and while Nagoya seem a very interesting breed that is distant from White Leghorn they are not junglefowl. When it comes to the Leghorn side of the experiments, I wouldn’t be surprised White Leghorn bred on a Swedish research institute and a Japanese research institute differed quite a bit. The breed differences in tonic immobility is not necessarily due to the genetic variants identified in this particular cross, especially since behaviour is probably very polygenic, and an F2 QTL study by necessity only scratches the surface.

In the discussion the authors bring up power: There were 71 Nagoya and 39 White Leghorn individuals and the experiment might be unable to reliably detect associations within the breeds. That does seem likely, but making a good informed guess about the expected effect is not so easy. A hint could come from looking at the effect sizes in the QTL study, but there is no guarantee that genetic background will not affect them. I don’t know really what this calculation comes from: ”Sample sizes would need to be increased more than 20-fold over the current study design” — maybe 11 tested copy number variants times two breeds? To me, that seems both overly optimistic, because it assumes that the entire breed difference would be due to these three QTL on chromosome 1, and overly pessimistic, since it assumes that the three QTL would fractionate into 11 variants.

Finally, with all diversity in the chicken, there’s certainly a place both for within and between population studies of various chickens with all kinds of genomic! Comparing breeds with different selection histories should be very interesting for distinguishing early ‘domestication QTL’ from ‘productivity QTL’ selected under modern chicken breeding. And I wish somebody would figure out a little more about how tonic immobility works.

Literature

Abe H, Nagao K, Inoue-Murayama M (2013) Short Copy Number Variations Potentially Associated with Tonic Immobility Responses in Newly Hatched Chicks. PLoS ONE 8(11): e80205. doi:10.1371/journal.pone.0080205

From my halftime seminar

A couple of weeks ago I presented my halftime seminar at IFM Biology, Linköping university. The halftime at our department isn’t a particularly dramatic event, but it means that after you’ve been going for two and a half years (since a typical Swedish PhD programme is four years plus 20% teaching to a total of five years), you get to talk about what you’ve been up to and discuss it with an invited opponent. I talked about combining genetic mapping and gene expression to search for quantitative trait genes for chicken domestication traits, and the work done so far particularly with relative comb mass. To give my esteemed readers an overview of what my project is about, here come a few of my slides about the mapping work — it is described in detail in Johnsson & al (2012). Yes, it does feel very good to write that — shout-outs to all the coauthors! This is part what I said on the seminar, part digression more suited for the blog format. Enjoy!

Slide04(Photo: Dominic Wright)

The common theme of my PhD project is genetic mapping and genetical genomics in an experimental intercross of wild and domestic chickens. The photo shows some of them as chicks. Since plumage colour is one of the things that segregate in this cross, their feathers actually make a very nice illustration of what is going on. We’re interested in traits that differ between wild and domestic chickens, so we use a cross based on a Red Jungefowl male and three domestic White Leghorn females. Their offspring have been mated with each other for several generations, giving rise to what is called an advanced intercross line. Genetic variants that cause differences between White Leghorn and Red Jungefowl chickens will segregate among the birds of the cross, and are mixed by recombination at meiosis. Some of the birds have the Red Junglefowl variant and some have the White Leghorn variant at a given part of their genome. By measuring traits that vary in the cross, and genotyping the birds for a map of genetic markers, we can find chromosomal chunks that are associated with particular traits, i.e. regions of the genome where we’re reasonably confident harbour a variant affecting the trait. These chromosomal chunks tend to be rather large, though, and contain several genes. My job is to use gene expression measurements from the cross to help zero in on the right genes.

The post continues below the fold! Fortsätt läsa